
S&P 500 Q2 Earnings Surge vs. CPI Easing
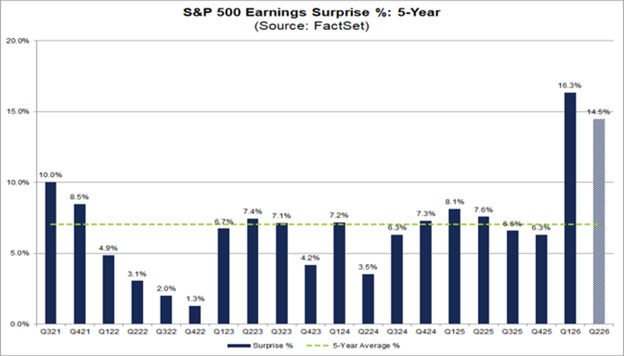
At the same time, 86% of S&P 500 companies reported an all-time high for their earnings index. And while the household budgets and the Corporate American markets are narrating two different, but connected stories, the gap between their claims would be driving money allocation within the markets for the weeks to come while highlighting a major concern - how much index-level exposure reflects genuine broad-based economic strength versus how much a narrower set of winners influence market performance estimates?
Table of Contents
- The Earnings Side: A Record-Breaking Quarter
- The Consumer Side: Cooling Inflation, Cooling Spending
- How Asset Allocation Has Been Shifting
- Data Snapshot
- What This Divergence Has Historically Meant
- Considerations by Investor Type
- Conclusion
The Earnings Side: A Record-Breaking Quarter
86% of S&P 500 companies recently set a new record by beating their estimated values of earnings-per-share, the highest rate of companies since Q2 2021. In aggregate, these companies also reported earnings 29.2% above analyst estimates, the highest surprise FactSet has recorded since it began tracking the metric in 2008, surpassing the prior record of 23.2% set in Q2 2020. This significant rise in numbers also marks the index's seventh consecutive quarter of double-digit earnings growth and its second straight quarter above 20%.
A majority contribution within those stark margins can be attributed to just two companies - Alphabet and Amazon. Both giants reported enormous non-operating gains with Alphabet from unrealized gains on equity holdings while Amazon basing it on its investment stake in Anthropic, leading to an inflated value from their reported EPS, well beyond what their core operations produced. And if you remove those two names from the tally, the index-wide earnings witness a staggering fall from 29.2% to a still significant 10.9%, a value aligning with historical averages. And that is noteworthy, making this quarter’s surging headline numbers mainly driven through two companies' balance sheets instead of an actual increase in five hundred company’s operating performance.
The Consumer Side: Cooling Inflation, Cooling Spending
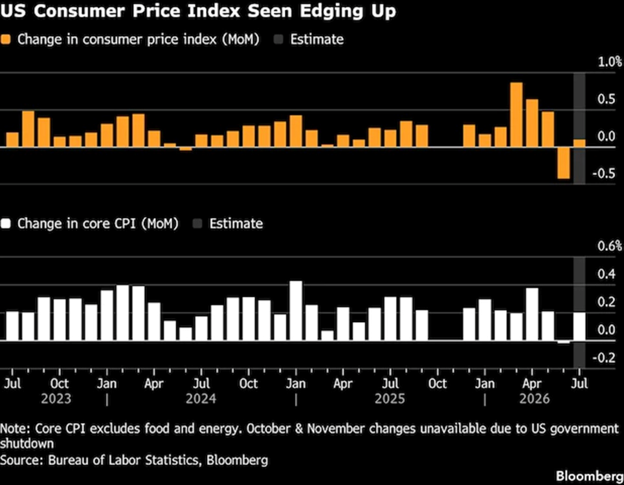
July's Consumer Price Index rose just 0.1% month-over-month, pulling the annual inflation rate down to 3.4% from 3.5% in June, a second consecutive month of lower range readings after an energy-driven spike earlier in the year. Core CPI, which excludes food and energy, also ticked down to a 2.5% annual rate.
Retail sales moved in the opposite direction from earnings. The Commerce Department reported retail sales fell 0.6% in July, the steepest monthly drop since May 2025, reversing a modest 0.2% gain in June. Online sales fell 2.2%, the largest decline of any category, and a closely watched "control group" measure that feeds directly into GDP calculations dropped 0.4% against an expected 0.3% gain.
And for a clear distinctive evaluation, July retail pullback numbers than July 2025 are not a directly comparable measure of underlying demand. Amazon’s Prime Day landed a month earlier this year, pulling e-commerce spending from the month of July into June’s number. But despite accounting for that difference, multiple economists continue to describe the decline as being broader and more significant than a single-event change, while restaurant spending remained amongst the only category still climbing.
How Asset Allocation Has Been Shifting
The strategist commentary in the recent cycle has observed the rise of several allocation themes against its experiences of cooling inflation, softening jobs data, and the growing expectations that the Federal Reserve will resume previous practise of cutting of its rates.
1. Reducing cash allocations.
Asset managers have also begun favoring bonds as the more lucrative income potential for investment while considering rate cuts and falling cash yields as a deviation from cash allocation preferences.
2. Selective equity positioning rather than broad index exposure.
Strategists have also separated lagging cyclical sectors like small-caps, financials, and industrials considering their ability to catch up if rate cuts successfully stabilize growth as compared against long-duration growth sectors like technology, which could also benefit from falling discount rates.
3. Increased defensive and hedge positioning.
Global gold ETFs have recorded multiple consecutive months of inflows, mainly based on a rotation of institutional capital while also reflecting choice of investors to hedge against the slowing rate of growth as well as broader policy-related uncertainty.
4. Continued emphasis on diversification across asset classes.
Major asset managers have also begun to emphasize on building diverse portfolios instead of focusing on a single narrative or aspect of investment while considering the difference in time and speed of response to economic shifts across categories such as stocks, bonds, commodities, and other alternatives.
Data Snapshot
|
Metric |
Reading |
Context |
|
S&P 500 EPS beat rate (Q2 2026) |
86% |
Highest since Q2 2021 |
|
S&P 500 earnings surprise |
29.2% |
Highest since FactSet began tracking in 2008 |
|
Earnings surprise ex-Alphabet/Amazon |
10.9% |
Closer to historical norms |
|
S&P 500 blended net margin |
15.7% (record) |
Up from 14.4% ex-Alphabet's unrealized gains |
|
Top 10 companies' share of index profits |
~34% |
About double the mid-1990s share |
|
July CPI (annual) |
3.4% |
Down from 3.5% in June |
|
July core CPI (annual) |
2.5% |
Down from 2.6% in June |
|
July retail sales (month-over-month) |
-0.6% |
Steepest drop since May 2025 |
|
July retail control group (feeds GDP) |
-0.4% |
Vs. +0.3% expected |
|
Consumer sentiment (Univ. of Michigan, prelim.) |
51 |
Down ~8% from prior reading |
What This Divergence Has Historically Meant
Historical periods where corporate earnings ran well ahead of consumer spending strength have raised questions of whether spending was decelerating because inflation-adjusted household budgets are genuinely tightening, or because a temporary pull-forward (like Prime Day timing) is distorting a single month's data? And identifying the correct reason is crucial as the first could pressure and dictate corporate revenue and guidance while the second could simply be resolved by the following month’s data.
Considerations by Investor Type
1. Long-term, buy-and-hold investors: The earnings-versus-spending divergence is a data point to note, not necessarily a signal to act on — broad diversification remains the standard approach for absorbing this kind of mixed macro signal without overreacting to any single month's report.
2. Income-focused investors: Falling cash yields amid rate-cut expectations are a reason some strategists suggest reviewing cash-heavy positions, though bond duration and credit quality remain relevant variables to weigh with a professional.
3. Active or tactical investors: The gap between mega-cap-driven index returns and broader consumer-facing sector performance is the kind of environment where index-level metrics can obscure meaningful differences between individual sectors and company sizes.
Conclusion
The gap between record corporate earnings and a cooling consumer index might seem contradicting but is rather a representation of how concentrated recent profit growth has become, and how the current economy is differentiating its distribution gains between large companies and everyday households. And while the question of the trend’s impact lingers, it truly depends on whether consumer spending stabilizes again or if corporate earnings begin experiencing the impact of cautious consumers first, something that will shape portfolios and market trends in the future. And while it’s difficult to predict how this will play out in the future, it’s enough to understand that there’s more than the headlines we see and perhaps an entire index’s record could be boosted by two companies' balance sheets while the economy experiences an actual spending slowdown at the same time!
Latest Posts